Why traditional site selection leaves multi-unit brands guessing
The standard process hasn't changed in 20 years. A broker surfaces a market, a lease gets signed. When it fails, no one can explain why.
Transactional, Not Strategic
When a site fails, no one can trace why. The same decision gets made in the next market.
Royalty Drag Compounds
One bad site costs $40K+ in lost royalties every year the lease runs. Meanwhile, the development story quietly deteriorates.
Franchisee Underperformance
Bad locations damage retention and show up in FDD disclosures, making every future franchise sale harder to win.
The Hope Strategy
1 in 5 new franchise locations underperforms within 3 years. Without data, the same pattern repeats at scale.
Generic location analytics can't model what makes
your top sites outperform your bottom ones.
SiteZeus, Placer.ai, Buxton, Esri. Every brand in your category runs the same tools on the same markets. That's table stakes, not a competitive advantage. Generic data can't model what makes your top 10% of locations outperform your bottom 10%.
- Same data, same conclusions — your competitors see identical traffic counts and demographics on identical platforms. The tool can't give you an edge if everyone runs it.
- Cell phone data tracks delivery trucks — foot traffic signals often reflect non-customer activity in mixed-use corridors. High traffic ≠ your customer.
- No brand fingerprint — off-the-shelf scoring ignores your own performance history entirely. Your best locations teach you nothing about the next one.
- Category calibration gap — a model trained on QSR data won't predict a boutique fitness studio's AUV. The category matters as much as the coordinates.
Your broker gets paid when a lease is signed.
Not when a location succeeds.
This isn't a criticism of brokers. It's a description of how the incentive structure works. Commission-based brokerage rewards getting to a transaction. Your brand's interest requires optimizing long-term unit performance. Those aren't the same goal.
Starts Where Inventory Exists
Brokers surface available space and landlord relationships, not necessarily the locations where your brand's performance data says customers actually convert.
Zero Reward for Saying No
Commission structure creates no financial incentive to walk away from a site. Even when the brand-specific data doesn't support signing. The pressure runs one direction: toward close.
No Cross-Market Intelligence
Regional networks have no visibility into how similar sites performed for your brand in other geographies. Every new market starts from scratch, with no institutional memory.
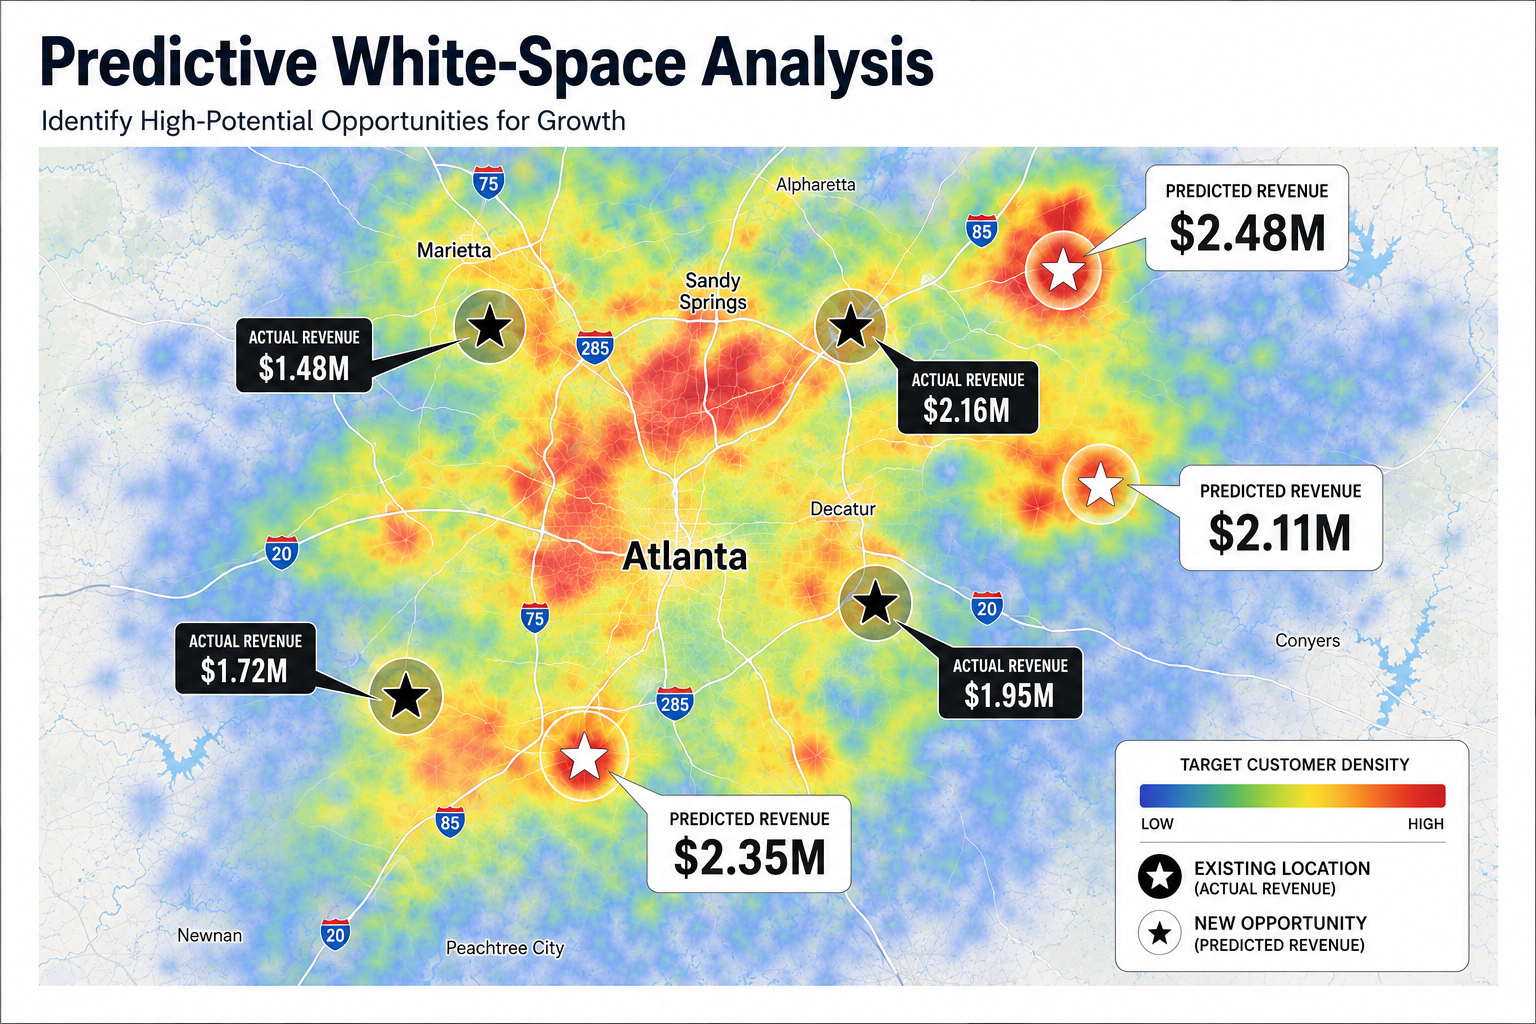
Growing without a territory map and a white space map means
someone else draws the lines.
Territory decisions made on intuition instead of data create two equally expensive problems: opening too close and competing with yourself, or leaving high-value markets undeveloped while competitors fill the white space. Either way, the brand pays. Neither shows up in the numbers until the damage is already locked in.
- No repeatable playbook — every territory decision gets made from scratch. Without a data-driven site criteria standard, approval is subjective, results are inconsistent, and the same mistakes repeat across markets.
- Opening too close compounds quietly — new units pull from existing units when boundaries aren't built on brand-specific demand data. AUV plateaus that look like saturation are usually cannibalization.
- White space goes undeveloped — high-potential markets sit unawarded while pipeline pressure forces approvals in the wrong places. Franchisee complaints surface 12–18 months before the root cause is understood.
- By the time it shows in the numbers, multiple leases are signed and sunk costs are locked in. A territory mistake is far more expensive to fix than to prevent.
Expansion should be predicted,
not guessed.
Per Location
Per New Opening
Fundamentally different strategic capabilities. All under one roof.
Most firms give you a tool or a broker. Windsor gives you a custom predictive model, a dedicated team, and full real estate execution — one accountable outcome, no handoffs.
Dramatically Better Results
Higher AUV, fewer underperforming units, better lease terms. Replicate what works — stop signing what won't.

Highly Custom
Not a generic algorithm sold off-the-shelf to every client. Every model is built from your own brand, your own customer, your own category, from scratch.

Dramatically More Data
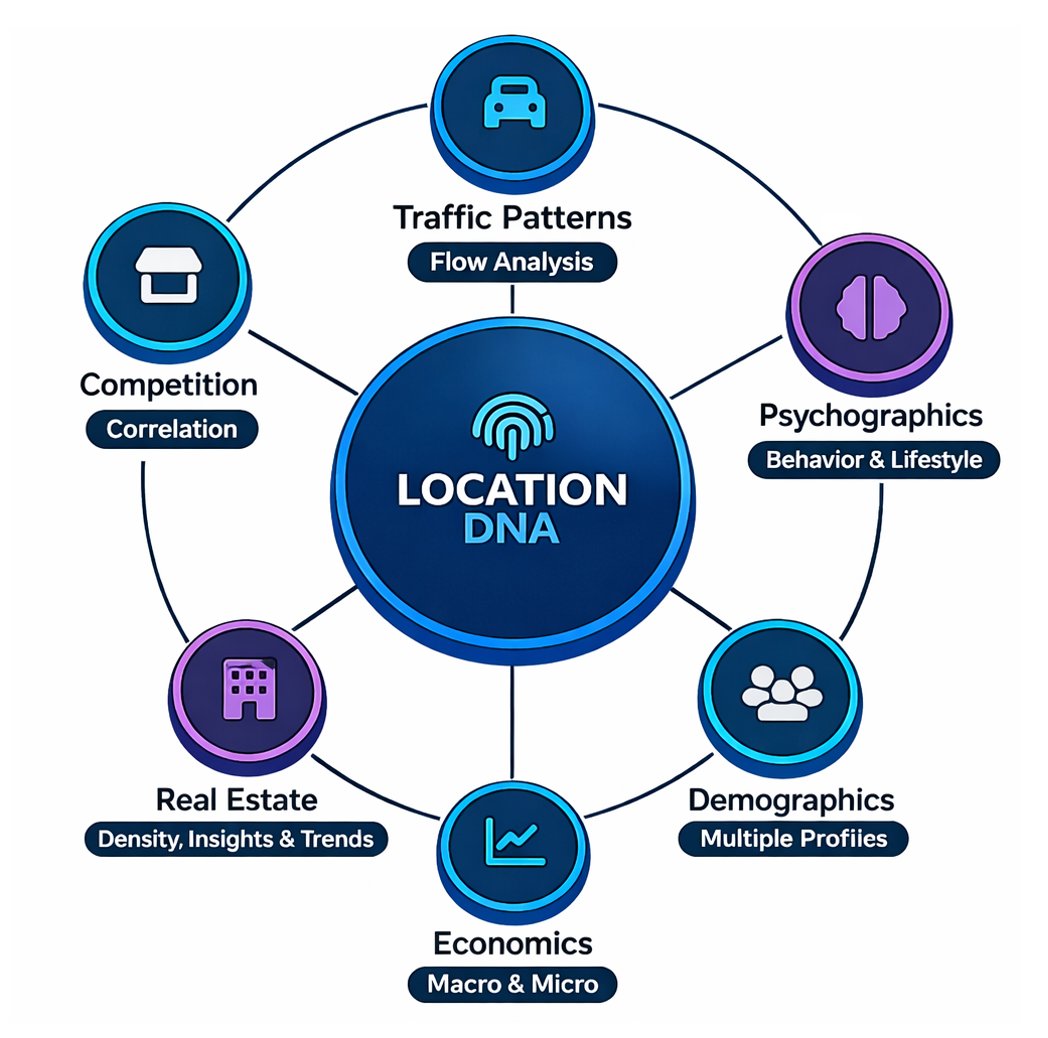
3,000+ variables: demographic, psychographic, traffic, competitive, economic — versus a handful of inputs in typical location analytics software programs.

Salaried Advisors, No Conflicts
Our team is on salary, not commission. The only advisors in your process with a financial incentive to say no when the data doesn't support a site.

A Full Embedded Team
A dedicated team designs it, builds it, tests it, and maintains it for you, not a login you configure and defend yourself. One team, one outcome, no handoffs.

Dynamic & Continuously Evolving
Every new territory and every new store changes the model. A living system, not a static report that's outdated the day you open your next location.

Better site evaluation and territory strategy compound
into millions in royalty and unit performance.
Every brand has stars and dogs. Windsor models the difference so your next locations perform like your best. Royalty compounds over a 5 to 10 year lease. Territory drawn correctly turns into white space you own rather than sunk cost. The value of a single decision, made with your brand's own data, compounds into the millions.
Royalty Upside Per Site
One site that hits a $1M AUV target at a 6% royalty rate returns over $40K in royalty every year the lease runs. Multiply that across a development schedule and it compounds.
Make Every Location a Top Performer
Industry benchmark: four in five new franchise units meet expectations within three years. Brand-specific predictive modeling is how you make the fifth one perform too — before the lease is signed, not after.
An FDD That Recruits For You
Performance patterns are visible 12–18 months before they would ever reach a complaint. Acting inside that window keeps your Item 19 telling the story that attracts the operators you actually want.
See where your brand stands
Find out where your location growth actually stands.
Fifteen questions. About four minutes. A diagnostic you can act on whether or not you ever talk to us.
You'll get a score, a breakdown across the three phases of location growth, and — for each one — what the gap is and what closing it is worth. We ask for an email at the end to unlock the breakdown.
Before you start
Fifteen questions, one screen each. Answer for how things actually work today rather than how they're supposed to. Nothing here needs a spreadsheet open — every question asks what your system can do, not what your numbers are.
What you get back
A score for each of the three dimensions, and for each one the specific gap your answers describe plus the first move that closes it. Your score appears as soon as you finish. The email is only for the detailed breakdown.